Chapter 5 Results
5.1 What influences the change in category of a hurricane?
Hurricanes are classified in different categories based on the Saffir-Simpson Hurricane Wind Scale, which classifies hurricanes with regards to their wind speeds and estimates potential property damages. The hurricanes categories come under five items:
- Category 1:
Very dangerous winds from 64 to 82 knot (kt) that will lead to some damage such as roof damage or snapped tree branches. A famous hurricane of category 1 is Danny, which hit Cuba and the Gulf of Mexico in 1985.
- Category 2:
Extremely dangerous winds from 83 to 95 kt that will produce extensive damage such as roof damage and siding, many toppled shallowly rooted trees and near-total power outage. A famous hurricane of category 2 is Erin which hit Florida in 1995 and caused 5 people to die and cost $700 million (1995 USD).
- Category 3:
Extremely dangerous winds from 96 to 112 kt will cause devastating damage such as removal of roof decking, power outage and power outage for days to weeks after the storm passes. Katrina is a famous hurricane of category 3 that lead to 1,836 deaths and $81 billion (2005 USD) in property damage in 2005. Major states impacted were Louisiana and Mississippi.
- Category 4:
Extremely dangerous winds from 113 to 136 kt that will cause catastrophic damage such as loss of most of the roof structure and exterior walls, fallen trees and power outage for weeks to months. A famous hurricane of category 4 is Harvey which hit Texas and Louisiana in 2017 with damage estimated to $125 billion (2017 USD) and 107 deaths in the United States.
- Category 5:
Extremely dangerous winds of 137 kt or higher that will cause catastrophic damage such as total roof and wall collapse, fallen trees, power outage for weeks to months and uninhabitable regions for weeks or months. A famous hurricane of category 5 is Andrew, which hit Louisiana and Florida in 1992 and whose damage accounts for $41.5 billion (2011 USD) and 54 deaths (approximately 1 million people were evacuated before the storm).
Besides, it is also worth distinguishing hurricanes from tropical storms, whose maximum sustained surface winds range from 34 to 63 kt. They are labeled category 0 in our dataset.
The strength of a hurricane can also be assessed by its barometric pressure, that is the pressure at its center: the lower the barometric pressure, the stronger the hurricane.
Finally, the size of a hurricane is defined by its diameter.
Let’s now examine those features on a parallel coordinate plot and see how they relate to each other.
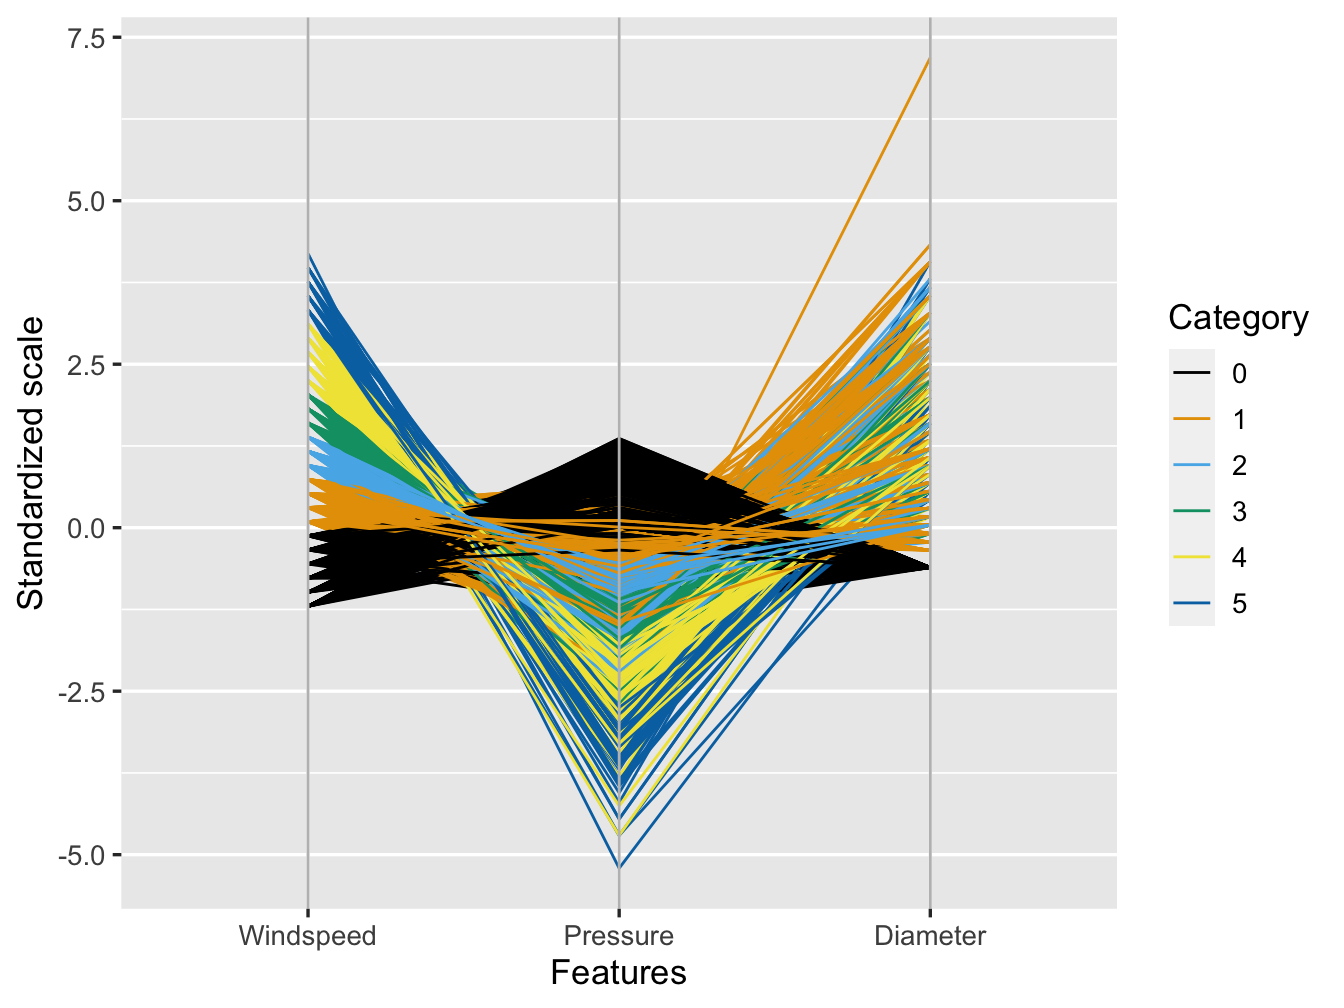
Figure 5.1: Windspeed and Pressure are indicators of cyclone category
First of all, as showing in Figure 5.1, categories are clearly distinct in terms of windspeed and increase proportionally to this feature. This is consistent with the definition of the Saffir-Simpson Scale. The same conclusion can be drawn for the barometric pressure measured at the center of the hurricane: for low pressures, the hurricane will be overall of a higher category. The distinction is however not as clear as for windspeed and some overlap can be noticed.
Furthermore, no relationship can be established between the diameter of the area experiencing hurricane strength winds of 64 knots or above hurricane diameter (hu_diameter), which would mean that the category, wind speed and min pressure will not determine the potential areas that will be affected by hurricane.
Note that all tropical storm have a diameter equal to 0: this is because the variable used for the graph is hurricane diameter, which accounts for the diameter of hurricanes. The diameter of the area experiencing tropical storm strength winds (34 knots or above) is reported in a separated variable called storm diameter (ts_diameter). As this project focuses on hurricanes, and these two parameters are highly correlated to each other, the decision was made to not include it in the graph.
5.1.1 A first look into the evolution of the category of hurricanes
Let’s now check whether a hurricane sticks to one category in its lifetime or if it changes overtime. To do so, we select three hurricanes of the same year: Irma (Florida), Maria (North Carolina) and Gert (North of Atlantic Ocean), which all occurred in 2017.
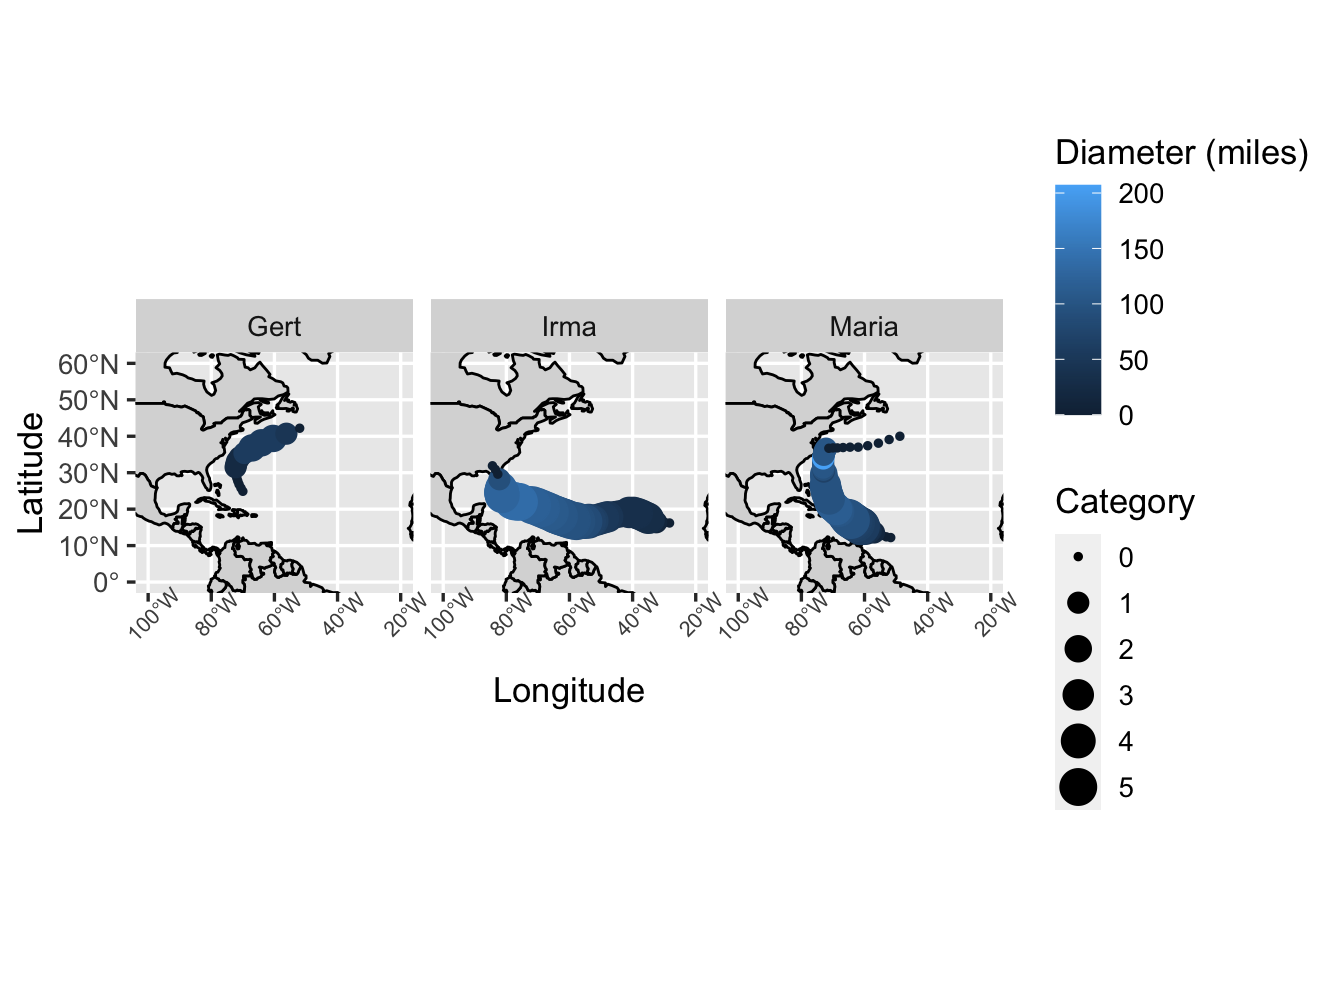
Figure 5.2: Three Example Hurricanes in 2017
From Figure 5.2, it can be noted that both Irma and Maria grew in intensity to reach category 5, while Gert only reached category 2 as a maximum. A difference in lifetime can also be highlighted (almost 2 weeks vs a couple days). As both Irma and Maria hit Southern states and Gert occured at a Northern location, the following hypothesis is stated: is the maximum category reached by a hurricane dependent on its location? That is, is there a difference between the maximum category reached by Southern and Northern hurricanes?
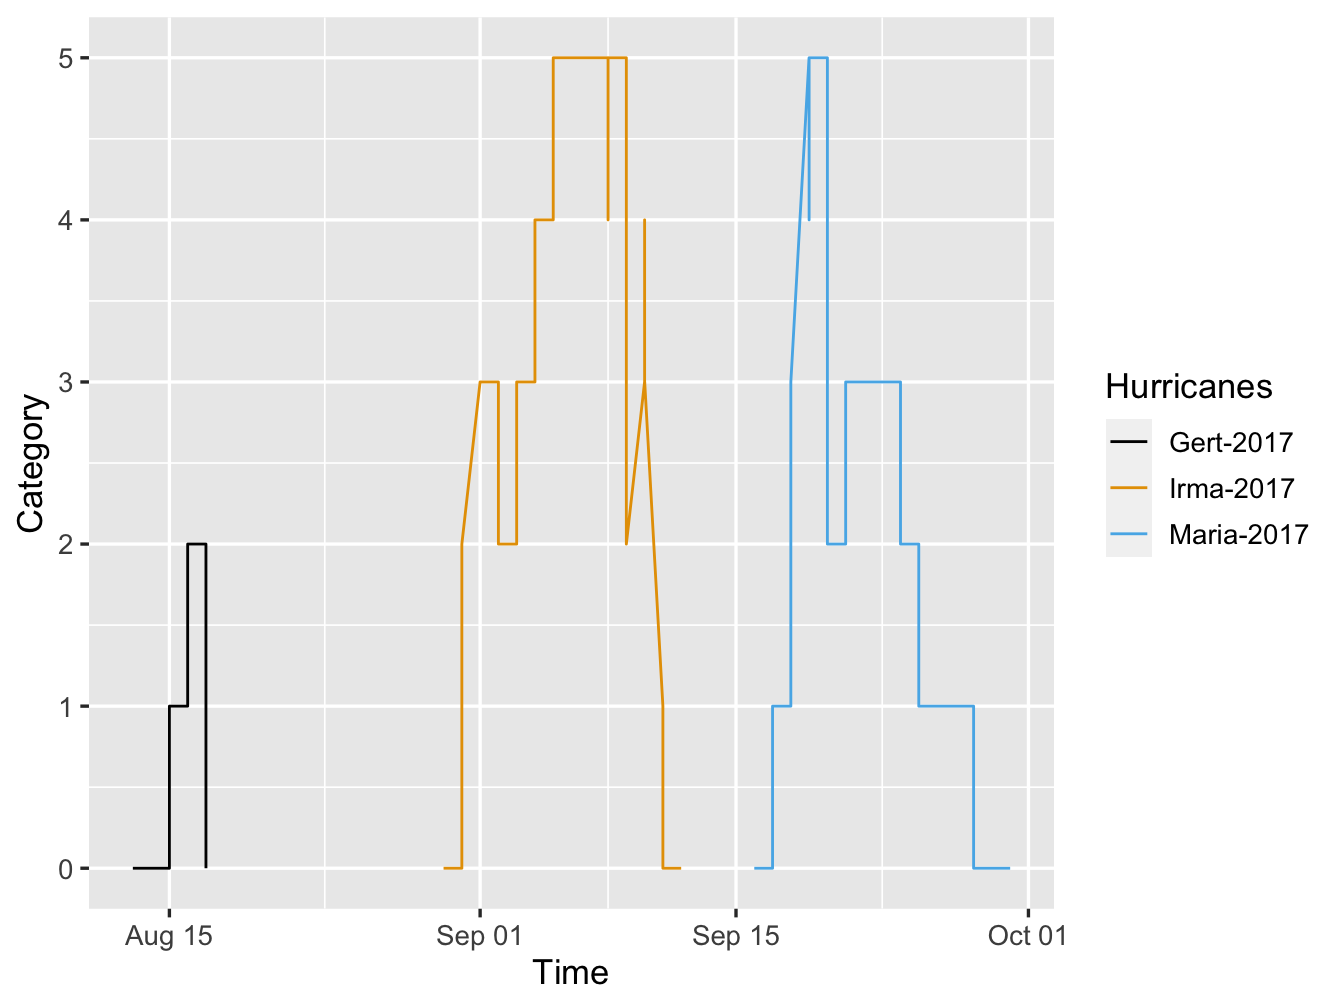
Figure 5.3: Time Series of Three Example Hurricanes in 2017
Before testing that hypothesis, it is worthy to note that the vertical jumping lines in the time series of hurricanes (Figure 5.3). These suggest that hurricanes are highly dynamic and can lose/gain energy in only a couple hours. This concept is illustrated by the following time series (Figure 5.4), showing a close up of hurricane Irma evolution on September 9th 2017; in a couple hours, the hurricane when from category 5 to category 2.
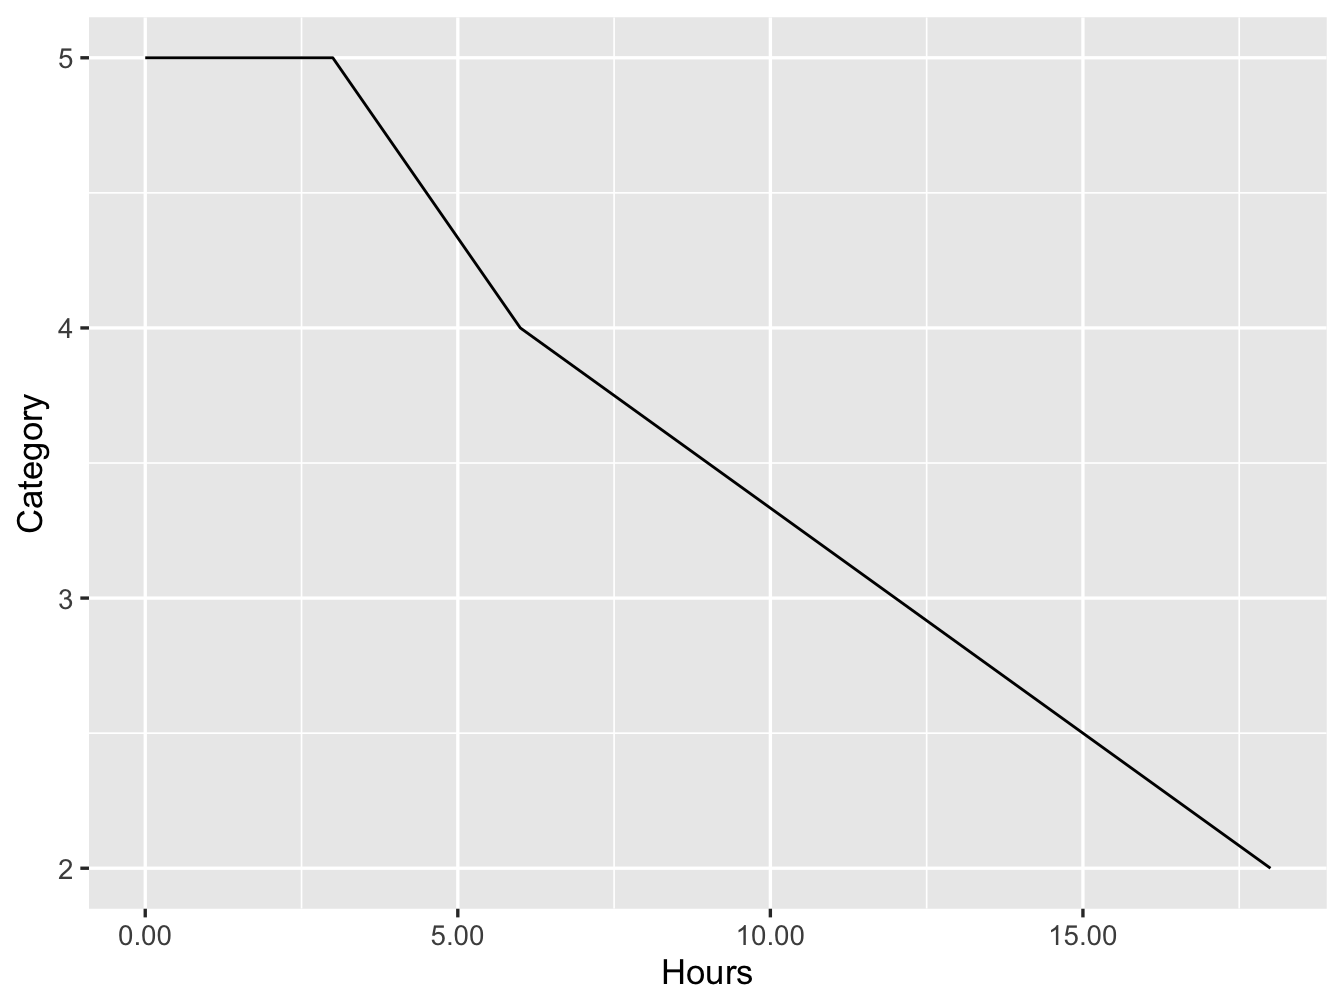
Figure 5.4: Close Up of Time Series of Hurricane Irma in 2017
5.1.2 Is there a difference between the maximum category reached by Southern and Northern hurricanes?
Let’s now verify whether the hypothesis holds. The Figure 5.2 depicts the path of each hurricane across time and also colors the diameter the area experiencing hurricane strength winds of 64 knots or above and sized according their categories.
Each hurricane formed in the low latitude east with a low category, then intensified (large circle and bluer) as it extracted energy from the warm/moist air over the oceans. As a result, its category evolved with time until it reached a certain point then dissipated. The hurricanes then broke apart because they move through cold water (e.g, Maria) or move over land (e.g., Irma) which made them losing touch with the hot water that powered them.
When hurricanes start at different location point, they absorb different amount of energy throughout their progression towards the west or northwest. This will lead to different energy formation that will determine the highest wind level measured, and in turn decide what that category of that hurricane will be.
The comparison of the hurricane track and intensity indicates that the longer the hurricane stay over the southern warm water, the stronger it gets to be (see Irma), while the northern formed storms, like Gert, could not reach high category and they die out a few hours after they start because they do not have enough energy to become a hurricane.
This seems to confirm the hypothesis stated above: there seems to be an interesting relationship between location and category of a hurricane. In addition, hurricanes seem to reach higher categories when located in the South of the Atlantic Ocean than in the North.
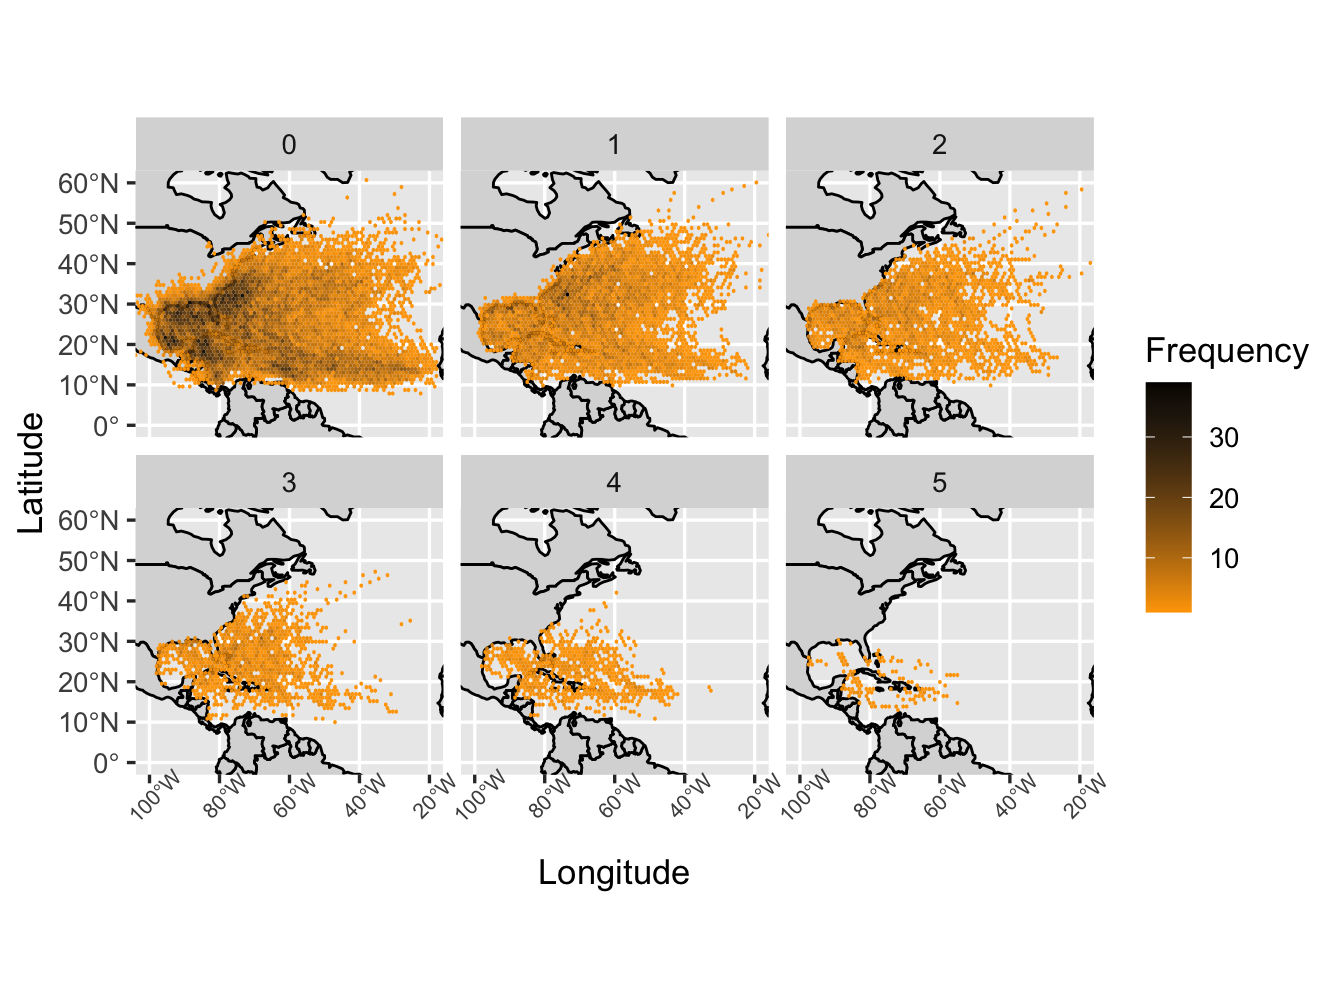
Figure 5.5: Frequency of Hurricanes across the United States
Let’s now check whether the hypothesis can be extended in terms of frequency. The frequency of hurricane by location for each category. Figure 5.5 shows that storms and hurricanes disappear when they reach the land or the northern water.
The low category storms (e.g., category 0 and 1) with the highest density along the coastline can reach further North, while the high category hurricanes (4 and 5) only appear in the South. The highest density along the coastline is related to the progress of the small tropical depressions. When these small depressions travel over the ocean to the US eastern coast, they gain energy and update to the category 0 storm. It is worth to note that as category increases, their north boundary seems to shift toward the south, suggesting the feature of storms and hurricanes are location-related.
We build a Shiny Web Application for the Interactive Component in order to assist with visualizing this result.
5.2 Does hurricane activity shift north-ward?
Next, we want to assess whether hurricane activity is shifting North. A recent study showed that the locations of tropical cyclones is shifting poleward (i.e. north-ward) globally (Thompson). If true, this implies heavy consequences for the Northern part of the United States. Southern states such as Florida have already taken steps to improve its approach to hurricanes, such as property structure improvements, rescue boats and vehicles investments, and emergency workers trainings; if the frequency of tropical cyclones is indeed shifting North, Northern states should consider taking similar actions.
Before exploring the above hypothesis, it is worth redefining latitude and longitude:
Latitude is the measurement of a place on Earth with regards to its distance north or south-wise from the Earth’s equator. Latitude is expressed in degrees followed by the letter N or S whether the location measured is North or South from the equator. Interesting examples for this project are Miami’s latitude (~26°N) and New York City’s latitude (~41°N).
Longitude is the measurement of a place on Earth with regards to its distance west or east-wise from the meridian at Greenwich, England. It is also measured in degrees and followed by the letter W or E depending on whether the location of interest is West or East from the meridian.
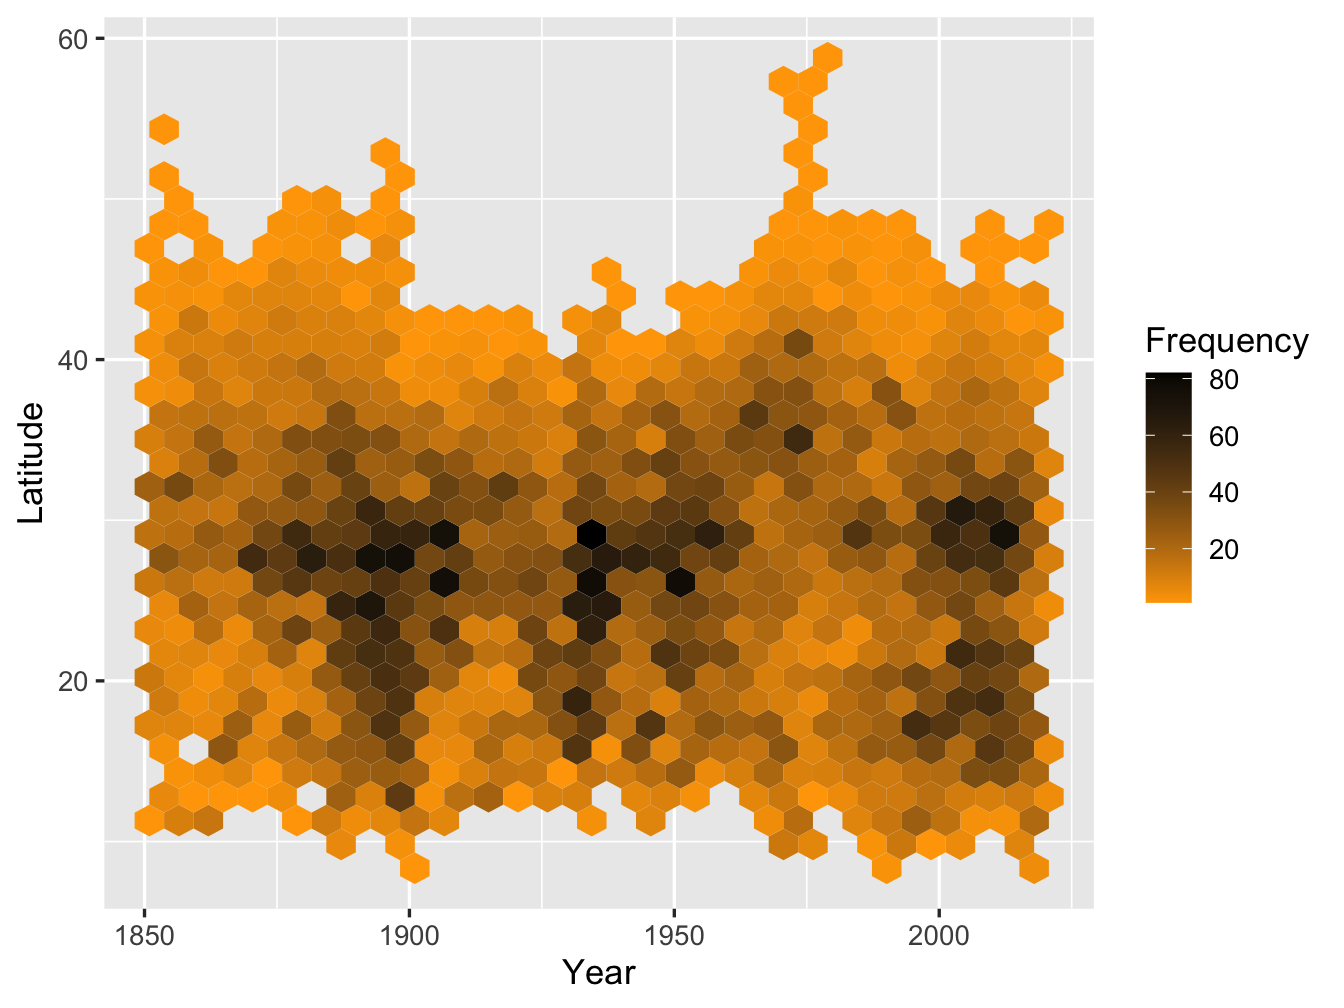
Figure 5.6: Frequency of Hurricanes by Latitude over Years
We will focus on latitude to verify whether hurricane activity seems to be changing directions. Figure 5.6 shows a heatmap of hurricane activity based on time and location. While tropical cyclones frequency seems to be consistently higher at lower latitudes, one can observe an increase in cyclones activity at higher latitudes in the 1970s. However, this shift does not seem to be permanent as the frequency of tropical cyclones seems to decrease again in the following decades.
Besides, if we look at the tropical cyclones activity faceted on category (Figure 5.7), the shift in location seems to be focused on tropical storms (category 0) and hurricanes of category 1. Hurricanes of category 4 are also more frequent on higher latitudes in the 1970s but the frequency remains at a low level and the activity returns to lower latitudes in the following decades. These observed trends would therefore not justify investments in hurricane-proofed facilities for Northern States.
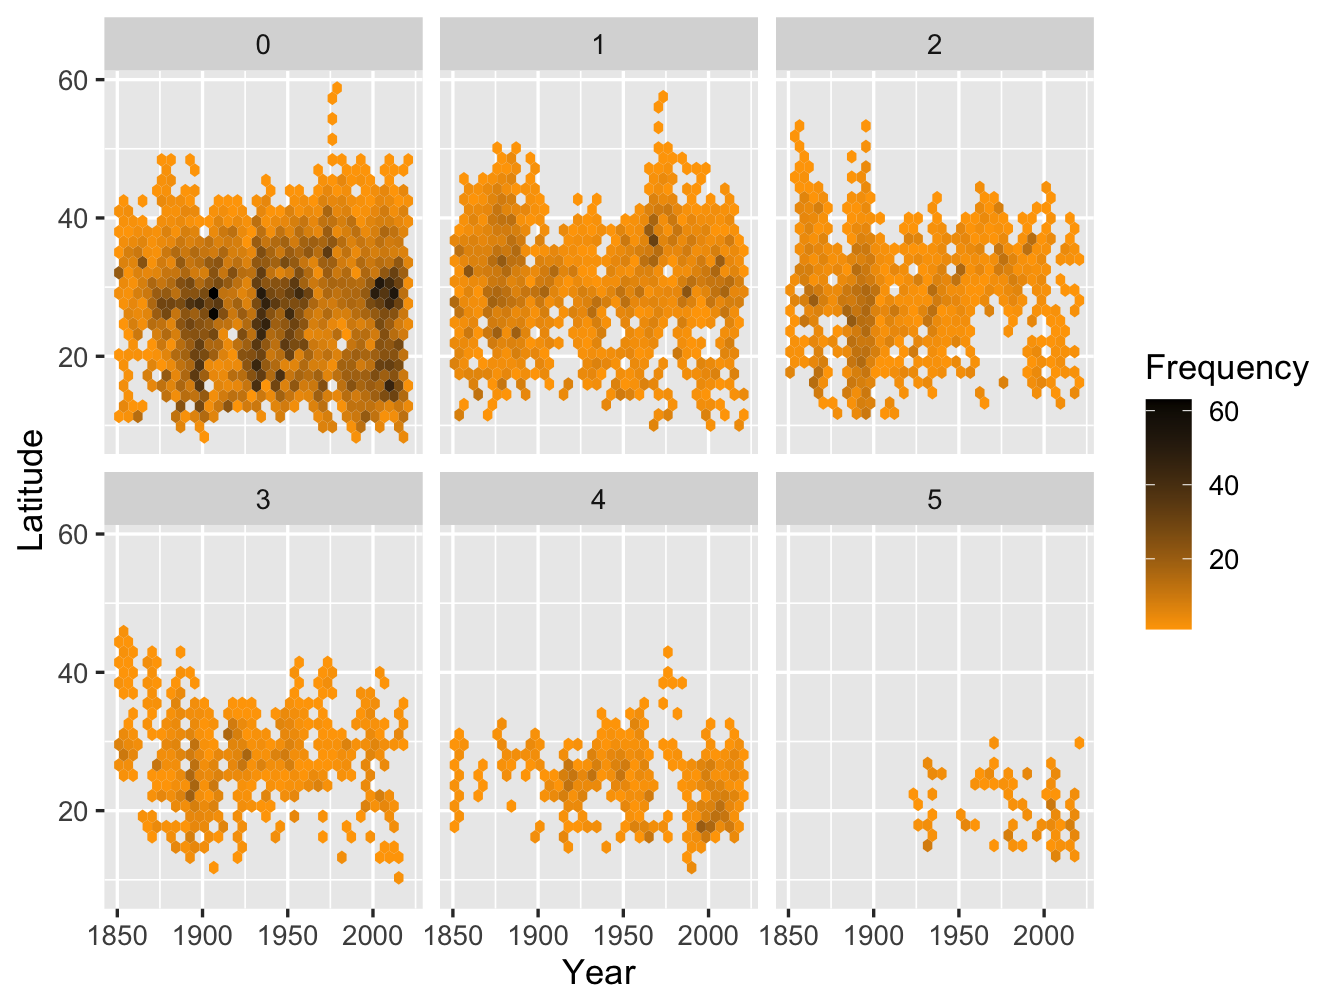
Figure 5.7: Frequency of each Hurricane Category over Years
5.3 Have humans already caused a detectable long-term increase in Atlantic hurricane activity?
As we can see from Figure 5.8, the global CO2 concentration has increased, and the tropical Atlantic sea surface temperature show significant warming trends (Figure 5.9).
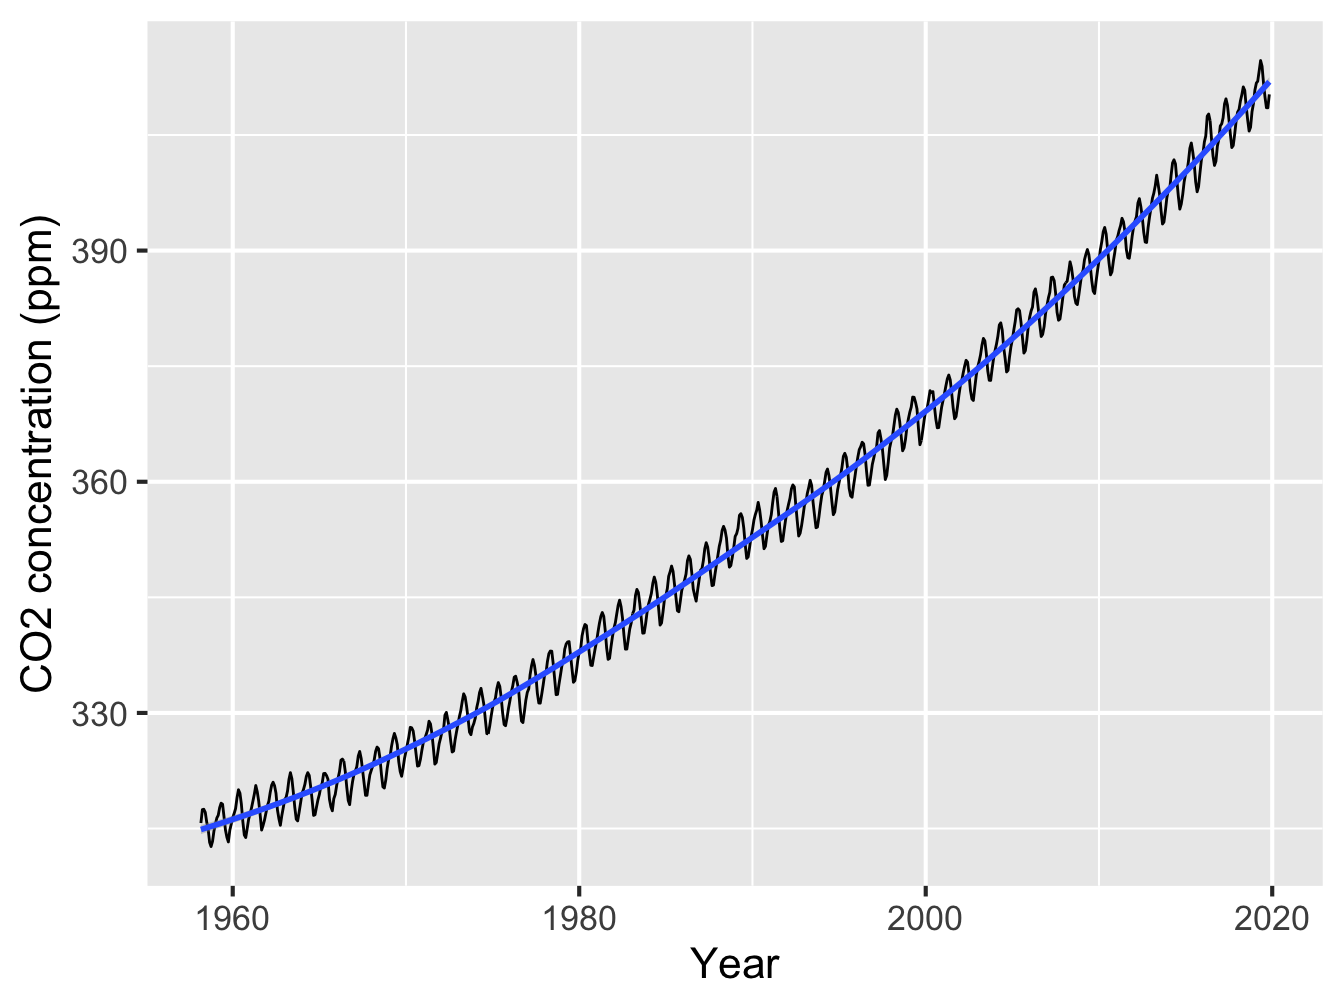
Figure 5.8: Time Series of Atmospheric CO2 (ppm)
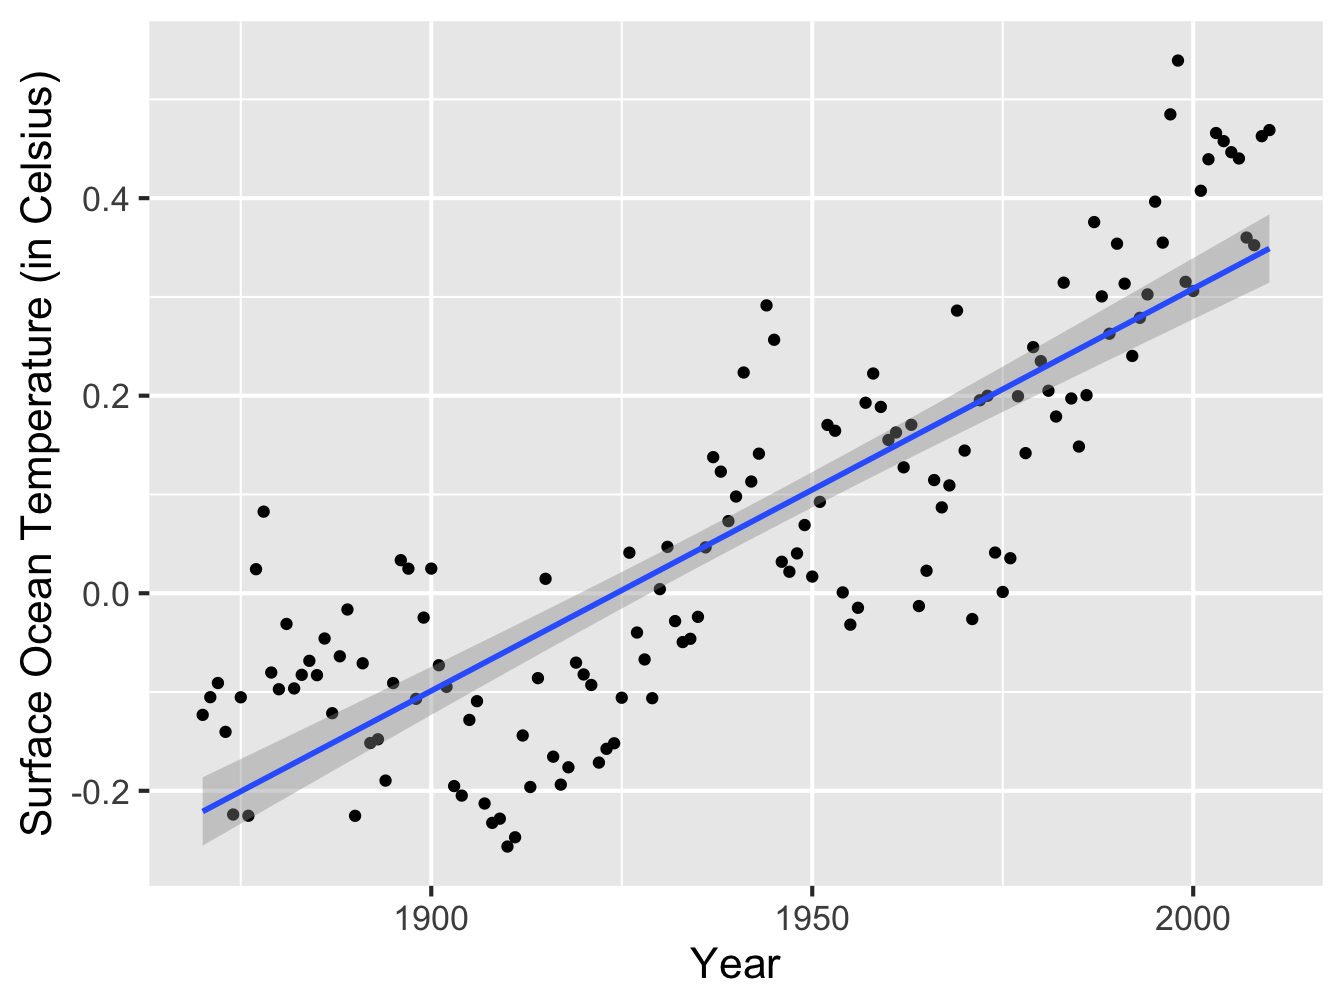
Figure 5.9: Time Series of Ocean Surface Temperature
Besides, one can also observed an increase in the number of storms and hurricanes in the Atlantic from 1851 to 2018 (Figure 5.10). We used this finding to ask the following question: is there a link between greenhouse-induced warming and changes in the Atlantic storms frequency (Figure 5.11)?.
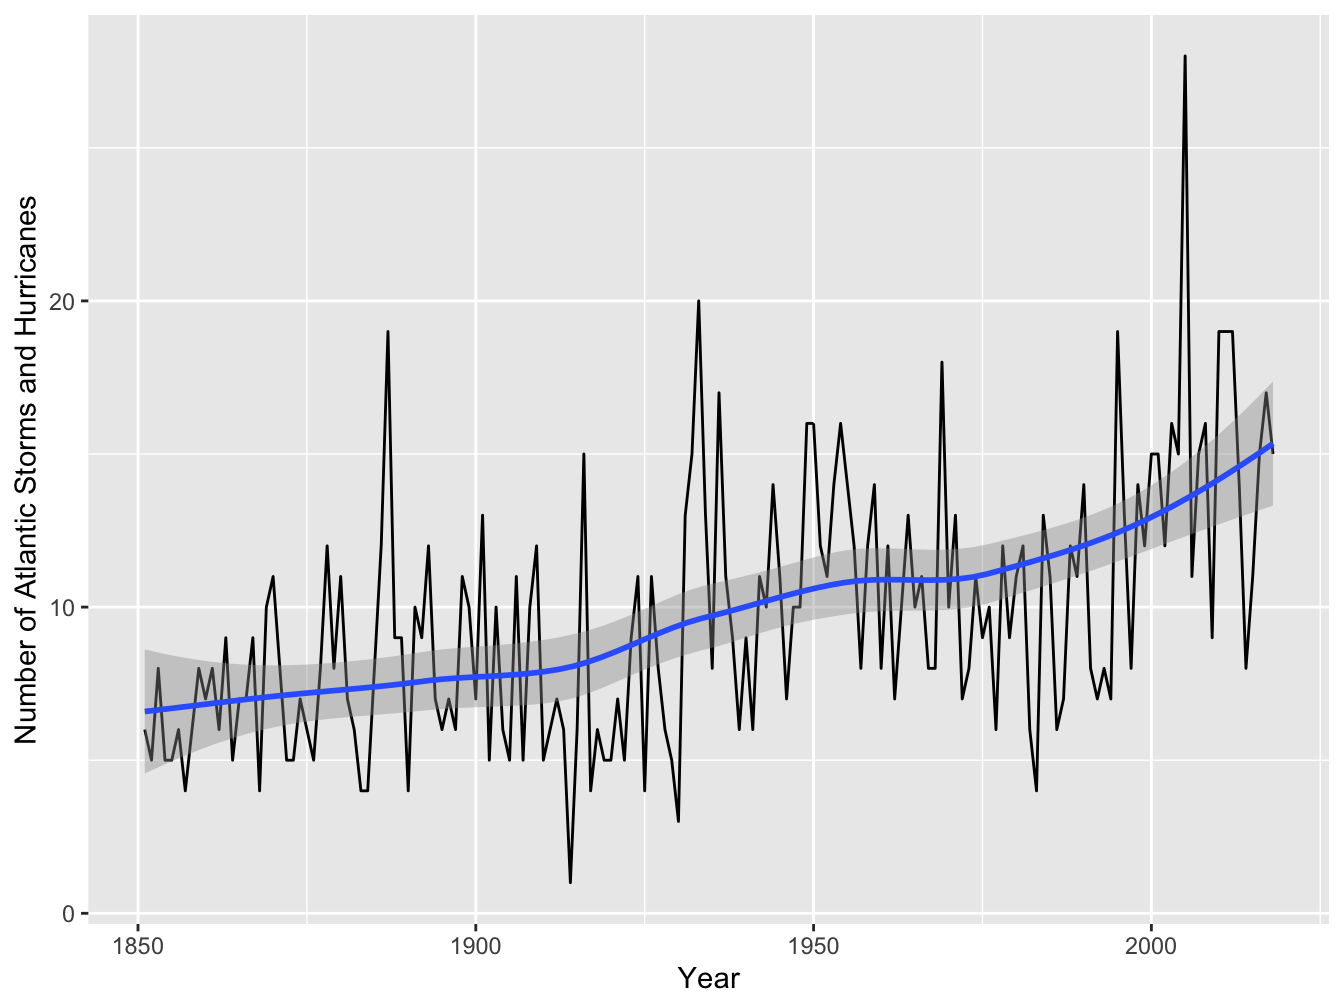
Figure 5.10: Number of Atlantic Storms and Hurricanes Over Time
Based on past Atlantic hurricanes records from 1878-2006, scientists concluded that the increasing trend in the number of Atlantic storms is almost completely due to the increase in short-duration storms (less than 2 days) (Landsea et al. (2010)), suggesting that only the count of short-duration storms follow a similar trend as the CO2 concentration and surface ocean temperature.
However, at the time, the focus was on storms that could have had an impact on ship traffic and, therefore, it is very likely that short-lived storms were overlooked in the earlier parts of the record. Besides, once our group explored the dataset with extra ten years’ record, we found that there is an increase trend on both short-lived and long-lived storms.
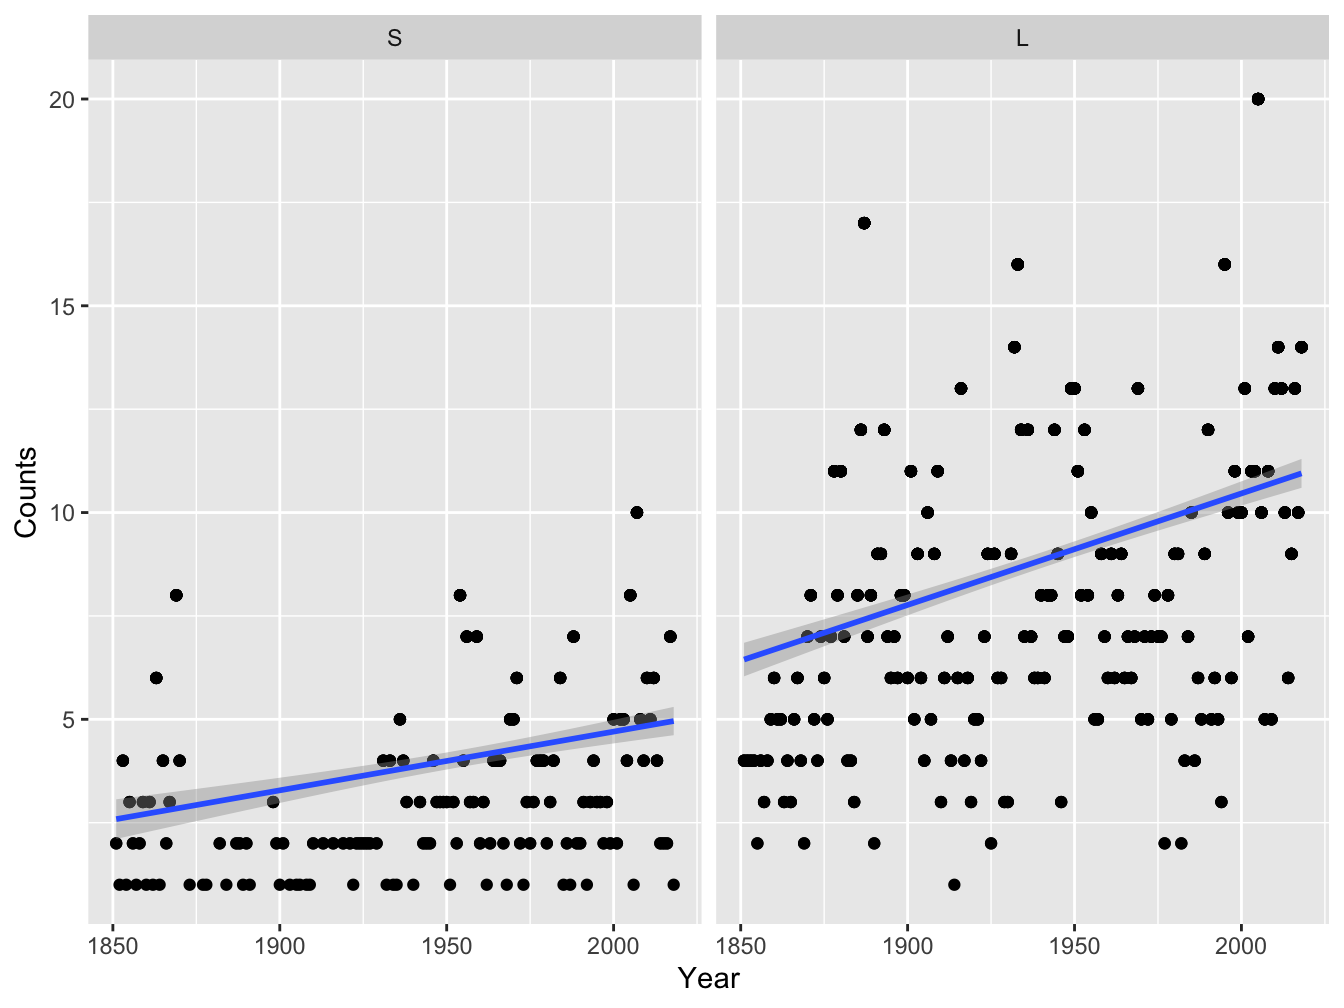
Figure 5.11: Time Series of Atlantic Short-lived (S) and Long-lived (L) Storms and Hurricanes Number
This means that the evolution of the number of cyclones over time follows a similar trend as the CO2 concentration and surface ocean temperature. This could mean that humans have had an impact on the increase of hurricane activity, but to prove that this is a causation and not only a correlation, deeper research and statistical tests should be performed.
References
Landsea, Christopher W., Gabriel A. Vecchi, Lennart Bengtsson, and Thomas R. Knutson. 2010. “Impact of Duration Thresholds on Atlantic Tropical Cyclone Counts.” Journal of Climate 23 (10): 2508–19. https://doi.org/10.1175/2009JCLI3034.1.